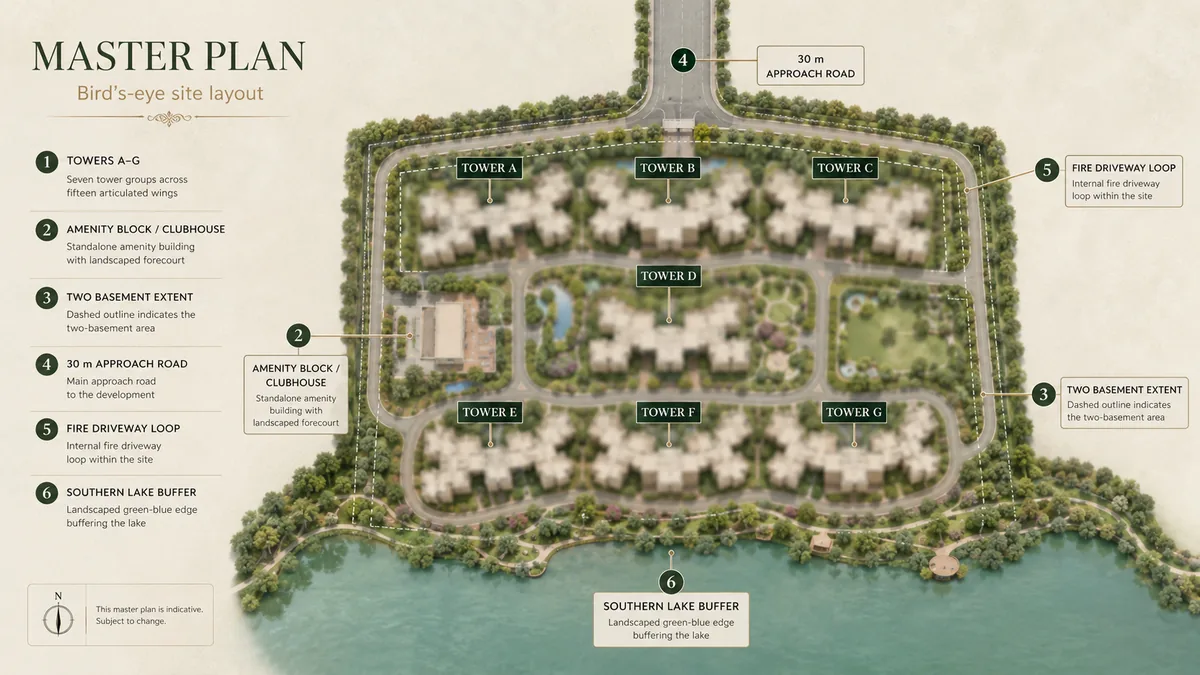
Ground coverage is the single number that separates a genuinely low-footprint scheme from a marketing claim, because it cannot be dressed up. It is the share of the site the buildings physically stand on, and at 13.19% it means roughly 3.97 acres of building footprint across 30.09 acres.
The trade-off that number buys is open ground, and it is buying a lot of it:
- Landscape and park together come to 62,005.16 sq m — 15.32 acres, or 50.9% of the development area. More than half the site is soft ground.
- Driveway takes 26.9%, which sounds heavy until you see what it carries (below).
- The building footprint is only the third-largest line item on the schedule, behind landscape and driveway. Park and open space, civic amenities and services all sit below it.
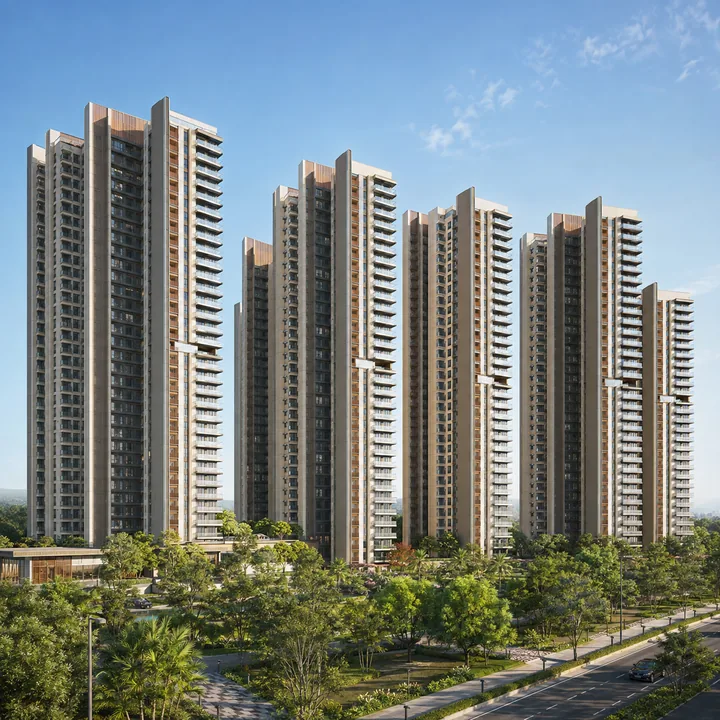
The price of low coverage is height, and the plan pays it openly. With a FAR of 3.26 applied to the development area, the sanctionable floor area is roughly 3,96,900 sq m. Divide that by the 16,056.44 sq m footprint and you get about 24.7 — which is, almost exactly, the Ground + 24 upper floors the towers are designed to. The scheme stacks its footprint twenty-five times because that is the only way to house a project of this size on four acres of ground. Total built-up area, including the non-FAR basements, is 5,52,042.27 sq m.
Park and open space lands on 10.00% to the second decimal — 12,175.88 sq m is precisely one tenth of 1,21,758.77. That precision is the signature of a statutory minimum met exactly, not a design decision. The 40.9% landscape allocation is the design decision, and it is the one that is four times any reservation requirement.
For context on why this matters in this micro-market: the branded competing supply within a couple of kilometres is small-format. A 1.7-acre single-tower scheme like Purva Heritage at Kudlu Gate cannot produce a 50% soft-ground ratio at any density, because its setbacks, driveway and fire access consume the site before landscape gets a turn. Ground-plane generosity is a function of parcel size, and parcel size is what this plan actually sells.
What the Revision Changed
The earlier plan on record and the Revised ToR are two different schemes on the same land. The direction of travel is unusual and worth reading carefully.
| Parameter | Earlier plan | Revised ToR | Change |
|---|
| Built-up area | 6,20,175.64 sq m | 5,52,042.27 sq m | −68,133 sq m (−11.0%) |
| FAR | 3.998 | 3.26 | −18.5% |
| Ground coverage | 18.86% | 13.19% | −5.67 percentage points |
| Water demand | 1,948 KLD | 1,740 KLD | −10.7% |
| STP capacity | 1,160+700+20 KLD | 900+700+20 KLD | −13.8% |
| Car parking | 5,218 | 4,900 | −318 bays |
Applied to the same 1,21,758.77 sq m development area, the coverage reduction alone hands back about 6,907 sq m — roughly 1.7 acres — from building footprint to open ground. Projects usually get denser between filings, not lighter. This one moved the other way on every measured axis. When the sanctioned plan and the RERA registration eventually land, the ground coverage figure is the first line to check for reversion.